

Section 5
5The Dual Dashboard
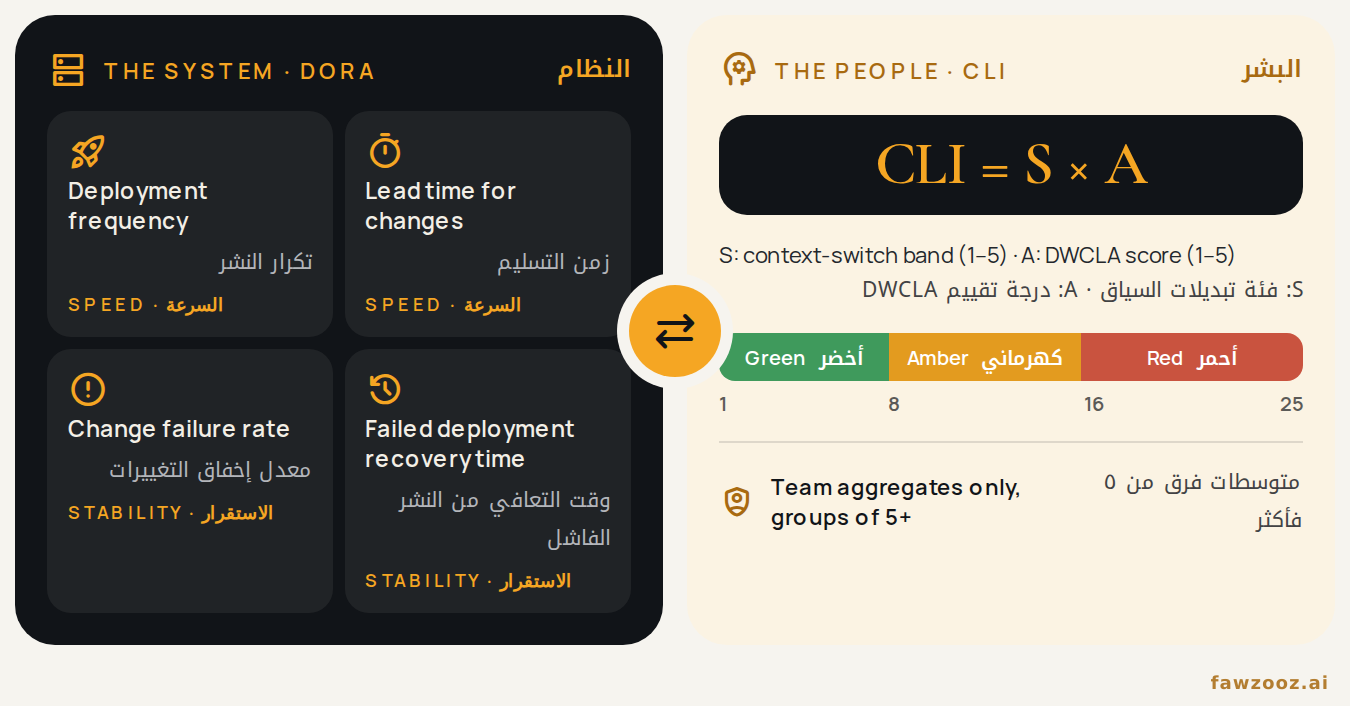
Fast teams often watch only the pipeline. Cognitive XOps puts two dashboards side by side: one for the system, and one for the people who run it.
Text in this figure
The system · DORA · Deployment frequency · Lead time for changes · Change failure rate · Failed deployment recovery time · The people · CLI · CLI = S × A · S: context-switch band (1–5) · A: DWCLA score (1–5) · Green · Amber · Red · 1 · 8 · 16 · 25 · Team aggregates only, groups of 5+
5.1 The system: DORA metrics
The system side tracks the four DORA delivery metrics: deployment frequency, lead time for changes, change failure rate, and failed deployment recovery time, which DORA long called mean time to restore (Forsgren, Humble and Kim, 2018). Frequent deployments and short lead times show speed. A rising change failure rate is the first sign that speed has started to cost stability.
5.2 The people: the Cognitive Load Index
The people side tracks the Cognitive Load Index (CLI) from The Cognitive Firewall. The index is inspired by IEEE 7010-2020, the IEEE recommended practice for assessing the impact of autonomous and intelligent systems on human well-being. IEEE 7010 does not define the index itself; it gives the reason we measure well-being next to performance.
How the Cognitive Load Index is calculated
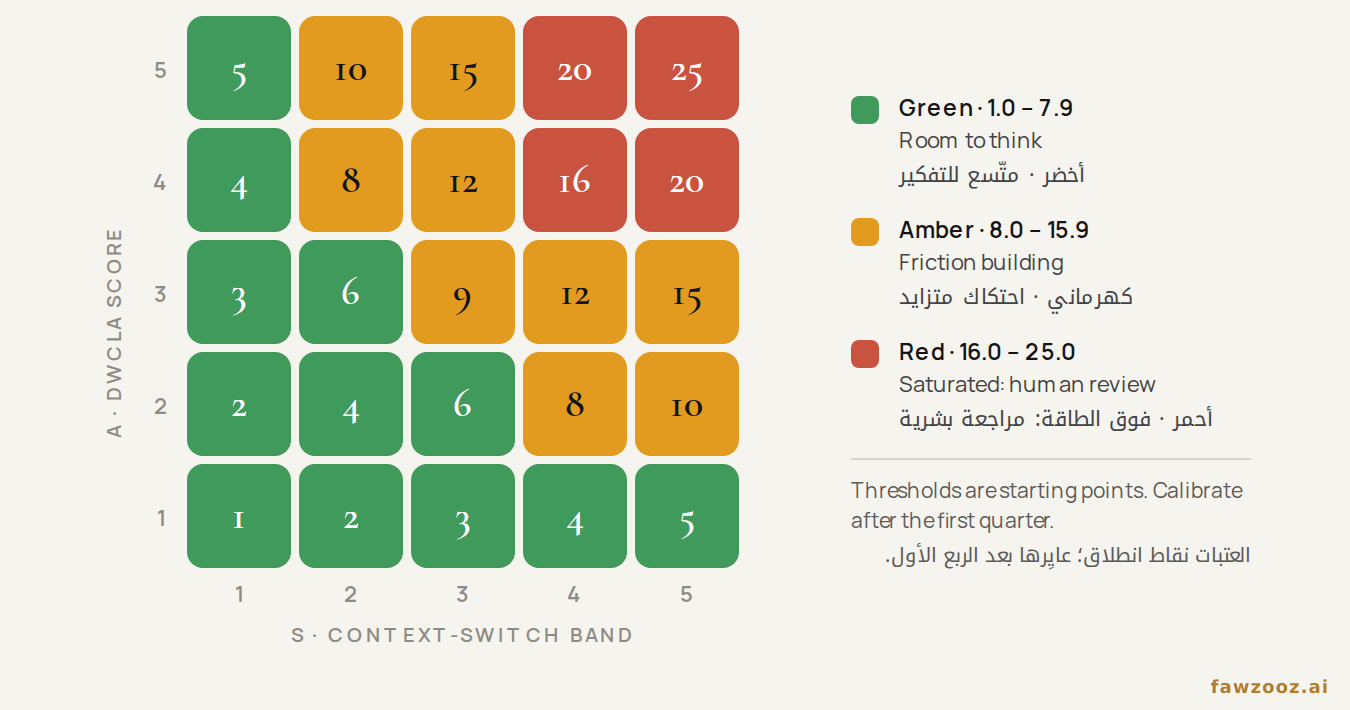
CLI = S × A
Measured at team level. S is the context-switch band: 1 for fewer than 4 switches per hour, 2 for 4 to 7, 3 for 8 to 11, 4 for 12 to 15, and 5 for 16 or more.
A is the team’s average score on the eight-item DWCLA assessment, on a scale of 1 to 5. Item 8 is reverse-scored.
The index therefore runs from 1 to 25. These thresholds are starting points; calibrate them against your own data after the first quarter.
Text in this figure
A · DWCLA score · 5 · 5 · 10 · 15 · 20 · 25 · 4 · 4 · 8 · 12 · 16 · 20 · 3 · 3 · 6 · 9 · 12 · 15 · 2 · 2 · 4 · 6 · 8 · 10 · 1 · 1 · 2 · 3 · 4 · 5 · 1 · 2 · 3 · 4 · 5 · S · context-switch band · Green · 1.0 – 7.9 · Room to think · Amber · 8.0 – 15.9 · Friction building · Red · 16.0 – 25.0 · Saturated: human review · Thresholds are starting points. Calibrate after the first quarter.
| Zone | What it means | |
|---|---|---|
| Green | 1.0 – 7.9 | The team has room to think. Keep going. |
| Amber | 8.0 – 15.9 | Friction is building. Review the workload at the next planning session. |
| Red | 16.0 – 25.0 | The team is saturated. A human review is triggered (Section 5.3). |
Privacy by design
Anxiety and workload scores are health-related personal data. Participation is voluntary, responses are anonymous, and results are reported only as team aggregates for groups of five or more. No individual score ever appears on a dashboard or feeds into a performance review.
5.3 When a team enters the Red Zone
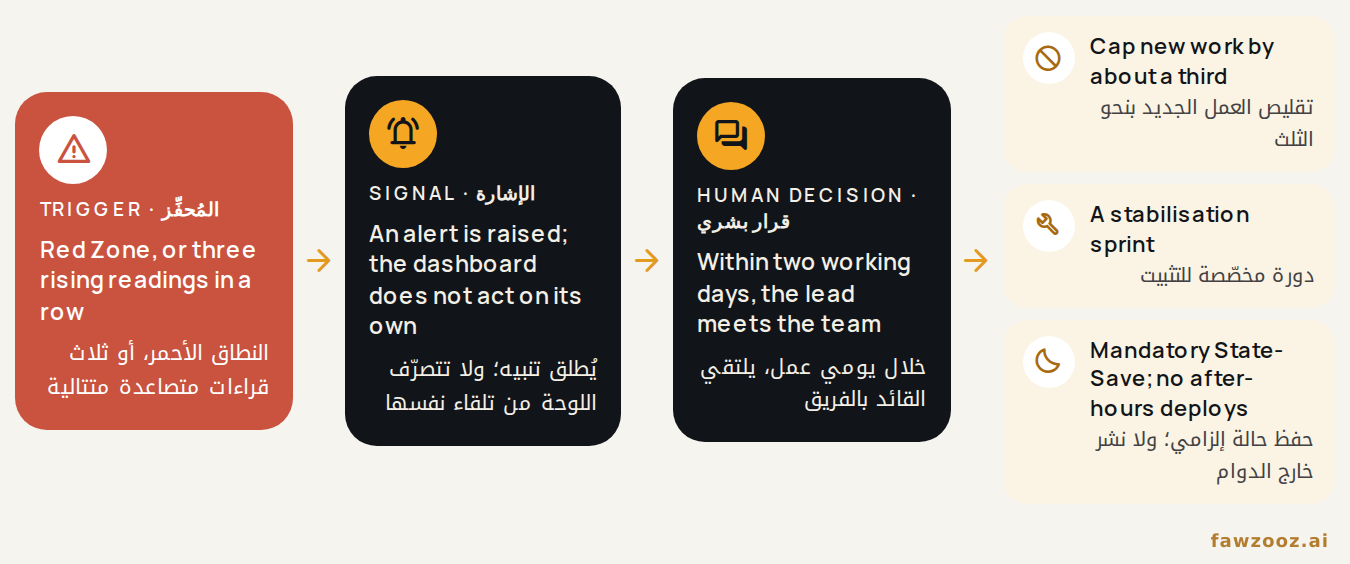
When a team’s CLI reaches the Red Zone, or rises for three readings in a row, the dashboard does not act on its own. It raises an alert, and within two working days the engineering lead meets the team and decides what to do.
We keep this decision human on purpose. If a survey score could automatically block deployments, people would soon learn to answer the survey strategically, and the index would stop telling the truth. The lead usually chooses from three responses:
- Cap new work. Cap new work for the next sprint, typically by around a third.
- Stabilise. Give the sprint to refactoring, bug fixes and closing open loops rather than new features.
- Protect recovery. Make the end-of-day State-Save ritual mandatory and pause after-hours deployments until the index recovers.
Text in this figure
Red Zone, or three rising readings in a row · An alert is raised; the dashboard does not act on its own · Within two working days, the lead meets the team · Cap new work by about a third · A stabilisation sprint · Mandatory State-Save; no after-hours deploys
Tip: use ← → to move between sections.