

Section 7
7Field Case: Six Months with Fifty People
7.1 Setting and method
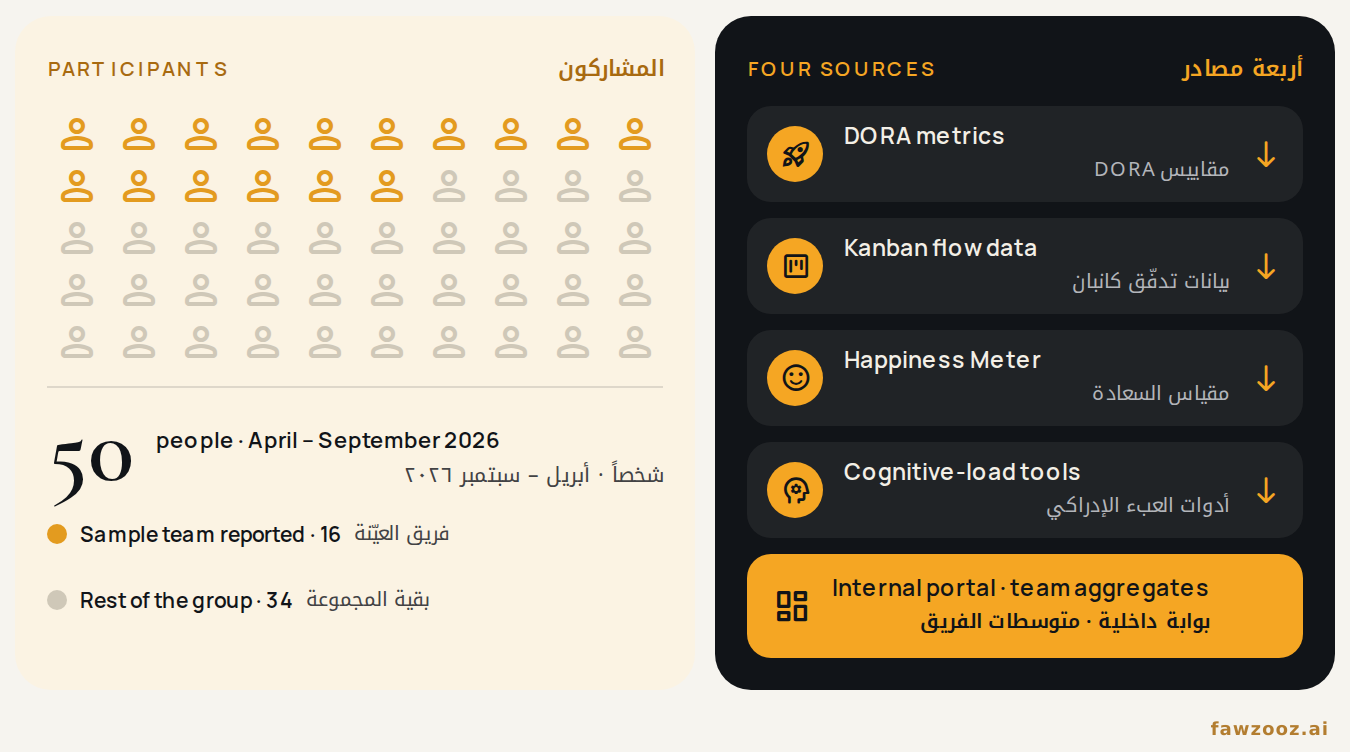
We ran Cognitive XOps for six months, from April to September 2026, with fifty people in a software development organisation. Everything was measured through an internal portal that brings four sources together:
- Delivery. DORA metrics pulled automatically from the version-control and CI/CD systems.
- Flow. Kanban flow data, including work in progress and cycle time.
- Sentiment. A Happiness Meter, where team members record how they feel about their work.
- Cognitive load. In-house tools that track the building blocks of the Cognitive Load Index, such as deep-work time and after-hours activity.
Text in this figure
Participants · 50 · people · April – September 2026 · Sample team reported · 16 · Rest of the group · 34 · Four sources · DORA metrics · Kanban flow data · Happiness Meter · Cognitive-load tools · Internal portal · team aggregates
We measured shadow AI through the disclosure and inventory policy described in Vibe Orchestration. Instead of banning unapproved tools, the policy invites every team member to declare the AI tools they use, records each one in the intake register, and encourages people to keep building with them through the approved gateway. The share of AI use running through that gateway at month 0 and month 6 comes from this register. All human measures were collected anonymously and reported only as team averages.
7.2 Results
Detailed figures for the whole group of fifty cannot be published. Table 5 therefore reports percentages from one sample team of sixteen people. It compares the final month of the study, September 2026, with the team’s long-run average in the portal. Metrics the portal did not report for this team are marked as not measured.
| Metric | Change | How to read it |
|---|---|---|
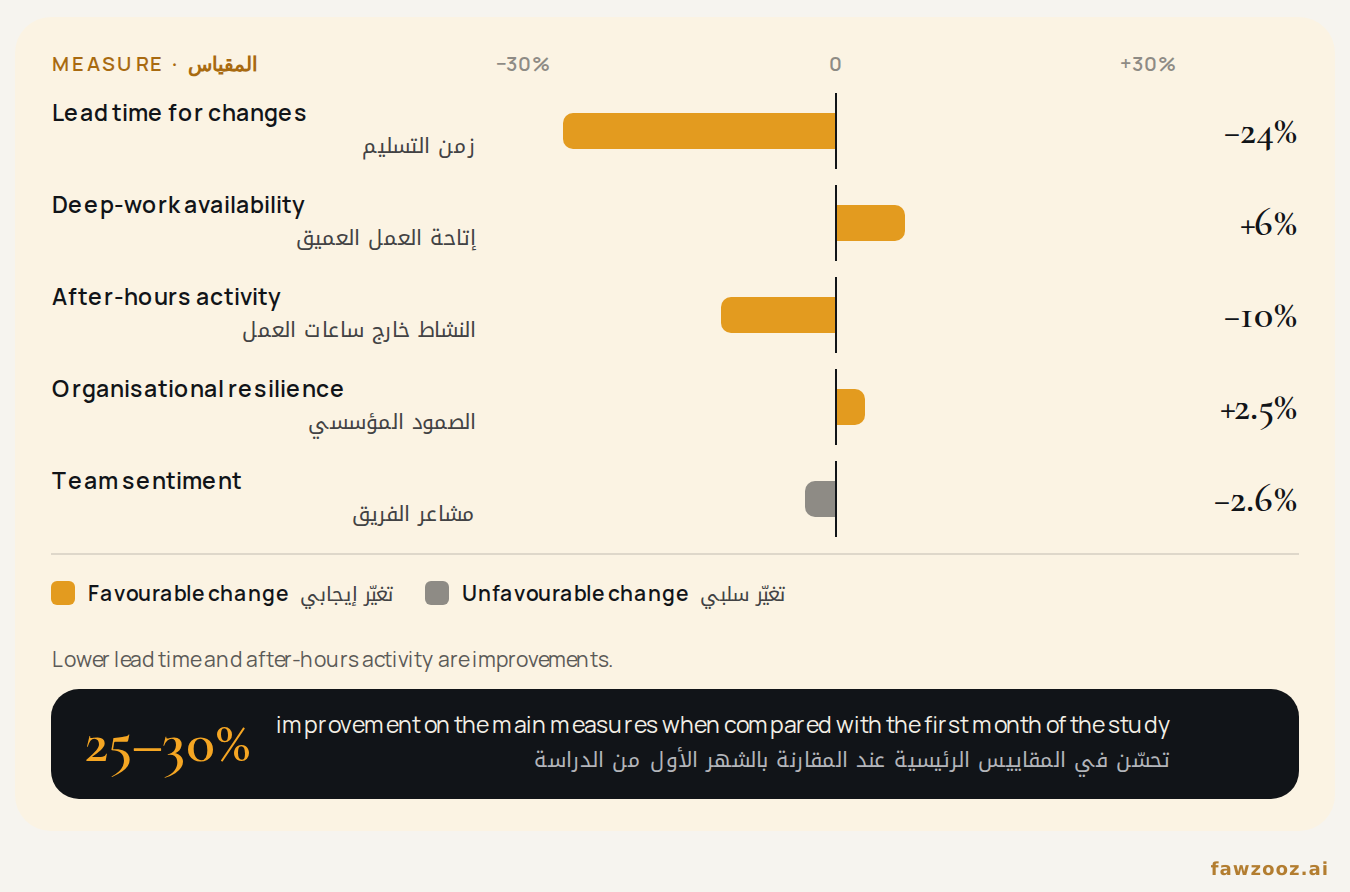
| Lead time for changes | −24% | Work reached delivery about a quarter faster than the long-run average. |
| Deep-work availability | +3.8 points (+6%) | More of the working day was left free for uninterrupted focus. |
| After-hours activity | −0.5 points (−10%) | Slightly less work spilled into evenings and weekends. |
| Defects per deliverable | +0.2 points (flat) | Quality held steady while delivery sped up. |
| System stability score | +1 point | Essentially unchanged. |
| Organisational resilience score | +2.5% | A small improvement. |
| Team sentiment (Happiness Meter) | −2.6% | Essentially unchanged; a slight dip. |
| Cognitive Load Index, recovery time, cycle time, shadow AI share, FinOps halts | Not measured | Not reported for this team in this phase. |
Text in this figure
Lead time for changes · −24% · Deep-work availability · +6% · After-hours activity · −10% · Organisational resilience · +2.5% · Team sentiment · −2.6% · Favourable change · Unfavourable change · Lower lead time and after-hours activity are improvements. · 25–30% · improvement on the main measures when compared with the first month of the study
The long-run average is a cautious reference point. When the portal compares the final month with the first month of the study instead, the team’s main measures show improvements of 25 to 30%. Release frequency in the final month was 7% lower than in the month before, a normal month-to-month swing that should be read alongside the other measures rather than on its own.
7.3 What the numbers can and cannot tell us
The comparison in Table 5 is weaker than a true before-and-after study. The long-run average covers the portal’s whole history, including months before the study began and the final month itself, so it is a reference point rather than a clean baseline. The team reports that its first months on the portal were weaker on almost every measure, and those months pull the long-run average down. This is why the changes in Table 5 are smaller than the 25 to 30% the portal shows when it compares the final month with the first. The figures also come from one team of sixteen, not the whole group.
These results come from one organisation, and there was no comparison group. Other things changed during those six months too: people joined and left, the release calendar shifted, and simply paying attention to a team can improve how it works, an effect researchers call the Hawthorne effect. Part of any improvement may come from these rather than from the framework.
The shadow AI figures depend on disclosure. They show how much AI use people declared and moved into the approved gateway; a tool that nobody declared would not appear in either month. We treat the register as a strong signal, not a complete count.
The Cognitive Load Index and the Happiness Meter are self-reported, and the DWCLA assessment is a pilot instrument that has not yet been statistically validated. The natural next step is to repeat the study with a second team and a comparison group, so that the effect of Cognitive XOps can be separated from everything else that changes in a working organisation.
Our six-month field case is a first step, not a verdict.
Tip: use ← → to move between sections.